TL;DR
- Point of Purchase displays (endcaps, dump bins, shelf talkers, digital screens) can deliver measurable sales lift — but only when tracked, linked to sales, and informed by shopper feedback.
- Up to 40% of displays are set up incorrectly or not at all (NielsenIQ, 2023), wasting budget and hurting ROI.
- A winning strategy includes:
- Tracking real-world setup
- Linking execution to sales
- Gathering shopper insights
- Presenting results as a retail-ready story
- Data-backed POP programs improve compliance, retailer trust, and long-term performance.
Why POP Displays Are More Than Just Merchandising
Brands from startups to giants invest heavily in point of purchase displays: large-format endcaps, dump bins, shelf talkers, and digital screens. But meaningfully proving their value means capturing what happens in store.
Recent audits show up to 40% of displays are set up incorrectly or not at all (NielsenIQ, 2023). This isn’t just a production failure; it’s wasted budget. And with retailers demanding more data, brands need proof, not promises, to justify trade and shelf space.
The Problem: Retail Execution Without Insight
Most POP campaigns fail because they lack three key things:
- Retail execution data: Tracking which stores actually set up the creative you invested in
- Sales linkage: Connecting store‑level execution to real outcomes, including sales, velocity, category share
- Shopper feedback: Understanding if the display actually moved consumer behavior
Without these, your campaign is just a box of material, not a driver of insight and accountability.
What Are Real-World Examples of POP Success?
Large‑format endcap drives discovery
A major snack brand recently deployed a large-format POP unit at aisle ends. Field audits confirmed live setup in 90% of stores, with displays remaining intact for four weeks. Compared to control aisles, these stores saw a 20% lift in new SKU velocity, showing how scale and visibility combined boost unplanned purchases.
Seasonal campaign uses storytelling to boost trial
A beverage brand launched a limited-time summer campaign using temporary corrugated displays with interactive packaging tied to a QR-enabled loyalty game. The displays were placed in high-traffic locations such as front-of-store coolers and checkout ends. In participating stores, they saw a 2.4x increase in redemptions and a 16% sales lift on promoted SKUs, driven by the combination of visibility and shopper engagement. Retailers supported the expanded run after early performance exceeded forecast in week one.
Shelf‑talker + shopper intercept
Beauty brands used shelf-wobblers to highlight ingredient stories. They paired visual merchandising with QR-linked surveys. 65% of buyers said the wobblers influenced their choice, supporting pricing power, and proof for retailers during planogram reviews.
How Can You Build a Smarter Pop Strategy? Follow This Four-Step Framework:
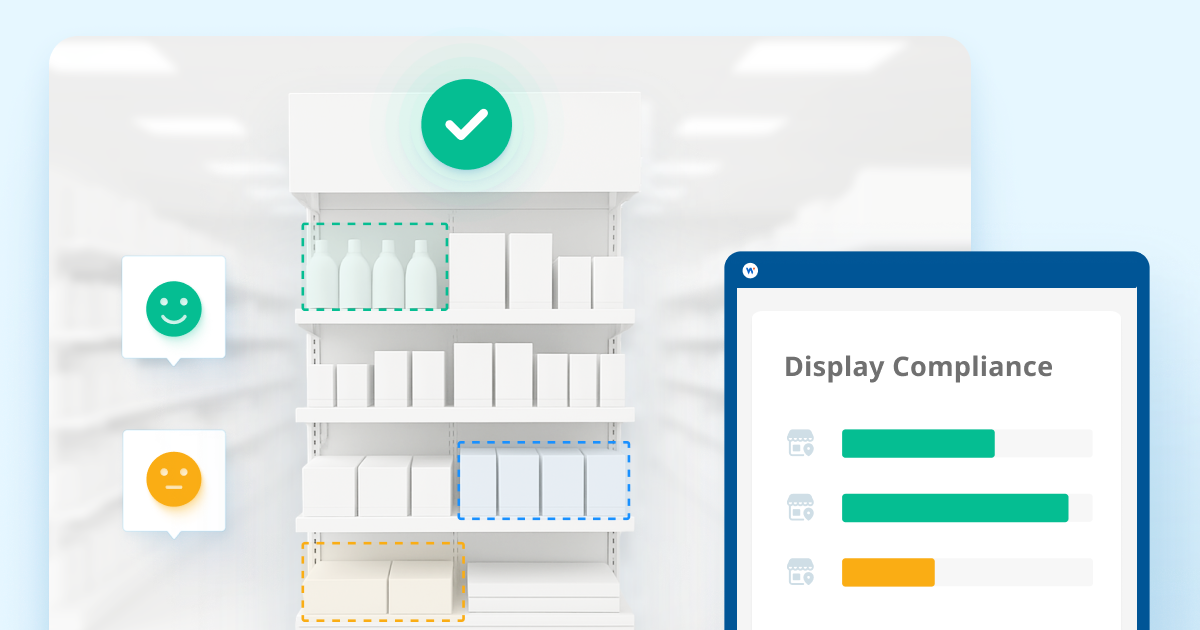
1. Track Real-World Display Setup with Accurate Timing
Start by verifying that displays are properly set up, stocked, and placed in the intended locations. Use field teams, store associates, or crowdsourced audits to track execution across your full retail footprint.
When should you audit?
Avoid rushing the audit too close to the shipment date. Most retailers follow a defined execution window based on their merchandising calendars. Displays are typically built after delivery but may not be live until several days, or even a week, later, depending on the retailer’s planogram schedule.
Best practice:
- Begin auditing 5 to 7 days after the start of the retailer’s display window
- Focus audits over a 2-week period to capture variation across geographies and store types
- Use timestamps and photo verification to document setup date, condition, and placement accuracy
By aligning your audits to the retailer’s actual merchandising cadence, you get more accurate data and avoid false negatives caused by premature checks.
Wiser Solutions data shows that non-compliance is most often identified during week one and week three of a promotion: week one due to missed setup, and week three due to display degradation or early teardown. Regular tracking helps you stay ahead of both.
2. Link Retail Display Execution to Sales Performance
Once store execution is verified, the next step is tying that execution to actual retail performance. This connection is where many display programs break down—brands see sales lift but can’t isolate whether it came from the display or external factors.
How to do it effectively:
- Segment your stores based on verified display compliance:
- Fully compliant (on-time setup, correct location, fully stocked)
- Partially compliant (late setup, incorrect location, incomplete stock)
- Non-compliant (display never set up or pulled early)
- Compare week-over-week or year-over-year sales data for the same SKUs in each segment.
- Adjust for baseline differences using historical sales trends or matched control stores.
This analysis helps you isolate true display-driven lift. For example, if fully compliant stores outperform others by 15 percent, and display timing was the only variable, that’s a strong signal the display made a difference.
Best practice:
Include both POS sales and shipment data where possible. POS reflects consumer demand; shipment data helps track sell-in effectiveness and identify inventory bottlenecks. Combining both gives a clearer view of how store execution affects performance.
3. Layer In Shopper Insights to Understand Why It Worked
Sales lift tells you that the display worked. Shopper feedback tells you why.
Brands that combine sales data with consumer input create a stronger foundation for creative improvements, brand positioning, and future promotional planning.
Tactics to collect feedback:
- In-aisle QR codes linking to 1–2 question surveys (e.g., “Did you notice this display today?” or “What caught your attention?”)
- Short intercept interviews (in person or via crowd platforms)
- Digital post-purchase surveys tied to loyalty apps or e-receipts
What to measure:
- Display recall and visibility (Did shoppers see it?)
- Message clarity (Did they understand the promotion?)
- Purchase influence (Did it affect their decision or trigger impulse?)
According to Path to Purchase IQ (2024), shoppers exposed to display messaging are 50 percent more likely to consider a new brand if the value proposition is clear and relevant. This insight helps justify continued investment in POP programs beyond aesthetics or legacy tactics.
Best practice:
Keep questions concise and incentivize completion (e.g., a giveaway or future discount). Pair the feedback with compliance and sales data to build a full view of display effectiveness.
4. Turn Your Findings Into a Retail Story That Drives Influence
With execution confirmed, performance quantified, and shopper input collected, the final step is to bring it all together into a story your retail partners can act on.
Most buyers are not swayed by anecdotal wins. They want structured insights that show how you drive incremental value—and how future investments can be de-risked.
How to package the results:
- Build a display performance dashboard or one-pager showing:
- Compliance rate by retailer or geography
- Display-driven sales lift vs. baseline or control stores
- Shopper feedback highlights (e.g., 68% of respondents said the display helped them discover the product)
- Tie the impact to category-level goals like driving traffic, increasing basket size, or shifting trade-up behaviors.
- Include visuals: display photos, heatmaps of compliance, or shopper quote snippets.
Best practice:
Use the same format across activations so you can track trends, benchmark campaigns, and refine retail strategies over time. A repeatable story builds credibility and helps your sales and category teams advocate for more space, better timing, or enhanced retailer support.
Why Do Retailers Value Data-Backed POP Programs?
- Pop‑up vs static: A 2024 Journal of Retailing study found shelf layout and display visibility increase demand by up to 7%, without price changes.
- Truth in accountability: Retailers expect proof. Data-backed POP programs signal professionalism and partnership.
- Long-term benefits: Compliance tracking reduces wasted spend. Shopper insights improve messaging. Sales linkage drives pricing discipline. All lead to better store support.
What to Do Right Now
- Audit your last POP campaign—did you know where each display landed and how it performed?
- Verify set up within 48 hours using mobile surveys or photo checks
- Integrate shopper feedback loops, like QR surveys or digital polls
- Set up weekly dashboards that show store compliance, sales lift, and shopper insight
- Communicate a data story to retail teams—show how intelligence translates to faster shelf adoption and higher returns
Final Thought
Point of purchase displays have power beyond aesthetics. When treated as measurable assets, they become instruments of growth—evidence-based levers for sales, shopper connection, pricing discipline, and retailer trust.
Today’s smartest brands use POP intelligence to prove what works, refine what doesn’t, and build their case for more space, better pricing, or category leadership.
Glossary
- POP Display: In-store unit designed to promote products at the point of purchase.
- Retail Execution Data: Measurement of how displays are implemented in-store.
- Compliance Rate: Percentage of stores executing a display according to plan.
- Shopper Insights: Data capturing consumer awareness, perception, and behavior.
FAQ
Q: How often should I audit a POP display?
A: Begin 5–7 days after the setup window starts, and audit over 2 weeks for accuracy.
Q: What’s the average compliance rate for displays?
A: It varies by category, but recent audits show up to 40% are set up incorrectly or not at all (NielsenIQ, 2023).
Q: How do I prove a POP display boosted sales?
A: Segment stores by compliance and compare sales lift, adjusting for historical trends.
Explore Display Intelligence Tools
→ Retail Intelligence for In‑Store Performance
→ Discover more Retail Intelligence FAQ’s
→ Calculate the impact of poor retail execution for your brand here.
Last Updated: August 2025