In‑store execution can boost velocity or quietly leak profit. The average SKU loses 6% of weekly sales to something as simple as a missing facing or an abandoned promo tag. Most brands learn about the damage only after the sales report lands. Wiser’s Retail Intelligence platform cuts that lag to a single day by collecting structured shelf data plus photo evidence from thousands of in‑store mystery shoppers and turning it into actionable retail audit insights.
Below are four shelf‑health topics high‑performing FMCG teams review every week. Check out our Retail Audit FAQs for deeper guidance.
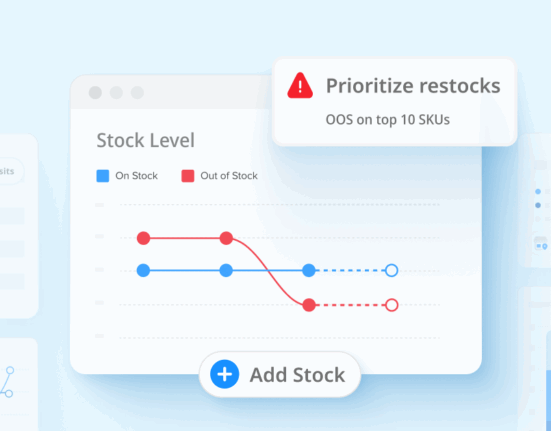
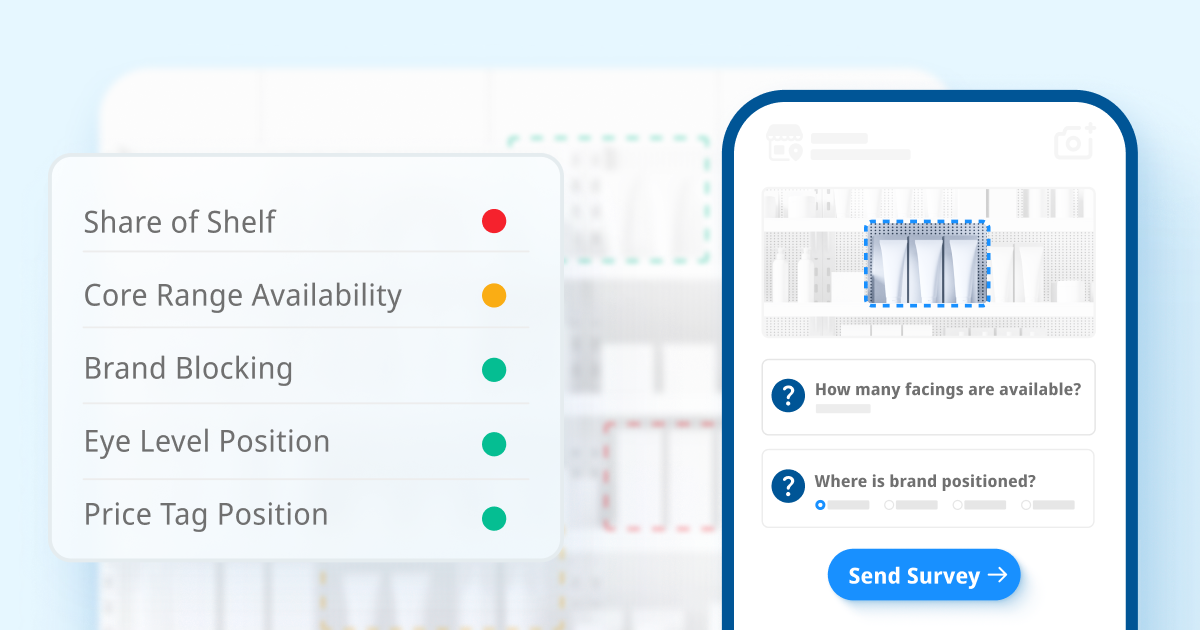
1. Product Positioning & Presence
A planogram is your blueprint, but gravity, staff turnover, and shopper habits quickly rewrite it. Track these data points:
- SKU availability. Shoppers confirm whether each listed product is physically on the shelf. A missing SKU triggers an alert before phantom inventory erodes sales.
- Facings count. Losing even one facing on a top line can shave three to six percent off weekly volume. Shoppers record the number they see so you spot deviations fast.
- Shelf location. Items at eye level move up to thirty percent more units than ankle‑level space. A quick grid reference pins down placement.
- Price‑tag presence and accuracy. Incorrect or missing tags drain margin and erode shopper trust. Auditors capture the shelf price and flag mismatches.
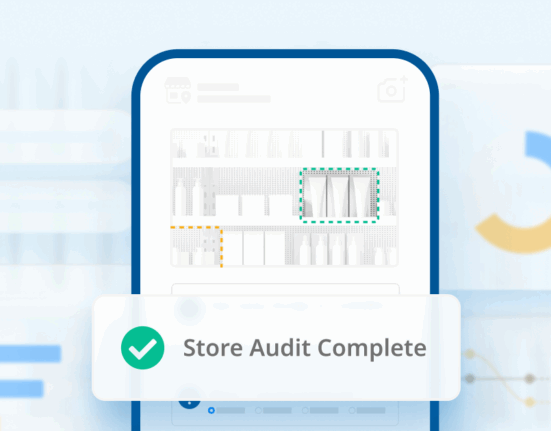
Photos back up every observation, giving retail teams proof to correlate to sales performance or locations where attention is neded.
Quick prompts
- “Count how many facings you see for this SKU.”
- “Snap a photo if a price tag looks wrong or is missing.”
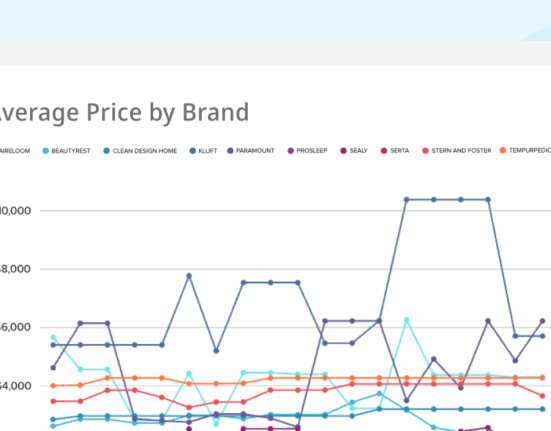
2. Competitive Space & Shelf Share
Shelf success is relative. Ten linear inches sounds healthy until you learn the category leader owns twenty. Capture:
- Share of shelf measured in linear inches or shelves and converted to percent.
- Brand adjacencies. Knowing you sit next to a premium peer versus a value brand can explain shifts in perception.
- Live competitor promotions. Field shoppers record BOGOs, price cuts, end‑caps, and secondary displays.
- Aisle leaderboard. Aggregated data ranks every brand by presence and placement.
Understanding the competitive space can be difficult without feet on the ground. Scaled data and photos help the team stay on top of what’s happening and how they compare.
Quick prompts
- “Which competitor stands out most on this shelf?”
- “Is any rival product on promotion today?”
3. Promotion Execution
Brands pour up to 25% of gross revenue into trade spend making it a critical part of their overall retail strategy, yet a third disappears when promos fail at store level. Verify:
- POS material. Is the correct promo material posted in the right spot? Shoppers gather the details and document the evidence.
- Discount integrity. Shoppers record the shelf prices and snap a photo for proof.
- Display uptime. Field checks on day one, mid‑campaign, and close‑out ensure secondary displays stay live for the full window.
Results feed a real‑time compliance scorecard, helping you redirect resources where it matters most.
Quick prompts
- “Is the promotional price clearly visible on the shelf tag?”
- “Take a photo of the end‑cap or stack display.”
4. Shopper Visibility & Sentiment
Even perfect execution fails if shoppers can’t locate or trust your brand. Layer perception-based questions into the audit to stay a step ahead:
- Ease of locating the category. A 1–5 scale exposes navigation friction inside the aisle.
- First brand noticed and why. The brand that wins attention first often wins the basket. Collect insights on color, packaging size, or promo.
- Product visibility. Auditors note whether your SKU is clearly in view or hidden behind clutter.
Wiser aggregates these responses into clear visibility insights you can filter by banner, region, or time period, highlighting where your product stands out and where extra consideration is needed.
Quick prompts
- “Which brand did you notice first, why? “
- “Where did you expect to find our product in store?”
From Data to Action
Picture starting each day with a dashboard that summarizes product presence, shelf share, promo execution, and shopper visibility—complete with photo evidence for every outlier. Sales reps know which stores to visit. Shopper marketing sees which displays drive lift. Category managers negotiate with facts rather than anecdotes.
Teams using Wiser cut issue‑detection time from weeks to hours and recover lost velocity before it hits the P&L.
Ready to see your shelf through the eyes of real shoppers? Book a live demo of Wiser’s Retail Intelligence.