


While we may not be able to see into our competitors’ ad campaigns, we can use the data that Google does provide to at least get a rough idea of where we are positioned, relative to our competitors. Used correctly, these tools give you the ability to capture your fair share of the market, while striking your competitors where they are weakest.

There are a few tools that Google provides with regard to our relative competition, but even the two that we’ll focus on (Impression Share and Bid Simulator) are pretty fuzzy on details, and not always reliable or consistent. But they are what we have to work with, and so we’ll just need to be a little careful about how we deploy them across our Shopping Campaigns.
Impression Share, for example, is stated as being “the impressions you’ve received on the Search Network divided by the estimated number of impressions you were eligible to receive,” according to the column’s tooltip. That sounds simple enough, as it implies that the pool of “impressions you were eligible to receive” represents a complete set of all potential impressions based on your keywords (or feed data, in the case of Shopping), and other Ad Rank factors other than your bid.
If that’s true, then there’s an implied metric hidden between the lines. If we divided our impression count by our Impression Share, we should get the total “impression pool” that we were eligible to bid for in auction.
So, if that were the case, we wouldn’t expect our own impression count to predict the size of the impression pool, right? The impression pool should be independent of nearly anything but the keywords (or Shopping feed data), with our Impression Share and impression count dictated mostly by our relative bids.
Except, that’s not what we find. The correlation between impression count and impression pool is actually startlingly clear:
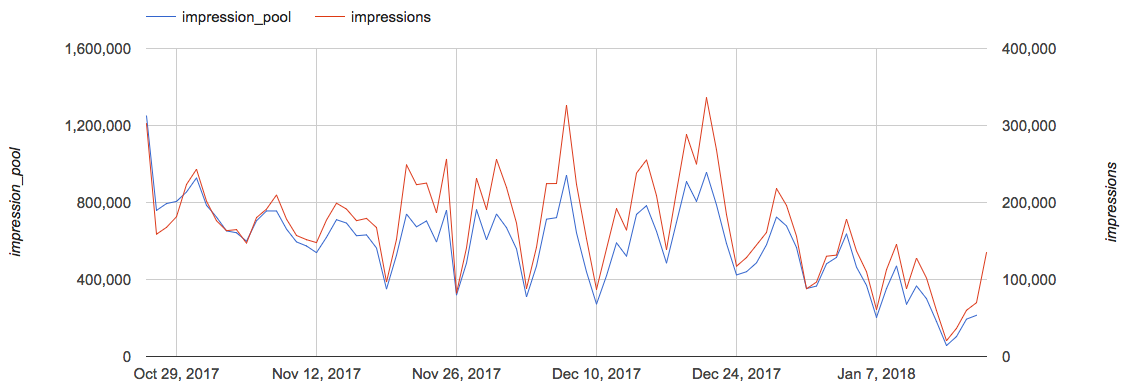
As you may expect, impression count correlates with average CPC, since it’s self-evident that higher bids (and therefore higher CPCs) lead to more impressions—that’s part of the point of the platform, after all. But if average CPC leads to higher impression count, and impression count is correlated with the impression pool, then we can make a fairly compelling case that the impression pool can’t be independent of our in-account activity.
While it’s true that the Impression Share doesn’t behave as if it were just as Google describes, it is still generally useful. If your bids remain fairly stable, and your product feed doesn’t change very much, then you can expect to generally find a stable impression pool (aside from seasonality), with your share going up where you have more impressions. A 25 percent Impression Share definitely indicates there’s plenty of market share left out there, whereas an 88 percent Impression Share may be approaching saturation.
The other tools (Auction Insights and Benchmark CPC, for example) have related, if slightly different eccentricities, but the point is that Google is careful not to reveal too much, while still trying to give you something vaguely useful.
The most common use of Impression Share I see is to identify where shares are low and bid more on those product groups. There’s more market share to go after, after all, so this makes sense, right? Well, what if you weren’t making much money on that product group up to this point? Then obviously a higher bid will drive up costs, and you risk slipping into the red on those ads!
Use the Right Metric for the Job

Most of us are familiar with using Return on Ad Spend (ROAS) to describe our performance or goals. But ROAS can be a bit obfuscated when you’re trying to manage your margins and ad spend.
I generally prefer the reciprocal of ROAS (costs divided by revenue, rather than vice versa), which I know as “Cost of Sale” (COS), expressed as the percent of revenue that you spent on the ads to generate it.
Now, armed with COS, let’s revisit that “there’s more market share out there, so we should raise bids” case again. This time, though, let’s assume that you’re aiming to spend no more than 10 percent of revenue, and you’ve been averaging around 9 percent for the past few weeks. In this case, go for it! A moderate increase in bids would likely yield a few more transactions, while staying near your COS target. If we make the opposite assumption, that you’d averaged 12 percent for the past few weeks, then raising bids would exacerbate the problem, eating even farther into your margins. Go too far, and you lose more money the more customers you attract—exactly what we’re trying to avoid.
Making More Out of Google’s Simulations
So, you can’t use Impression Share alone to drive bidding decisions. All of the other tools and reports we’re looking at share that same need for caution. The Bid Simulator, for example, provides output like this:
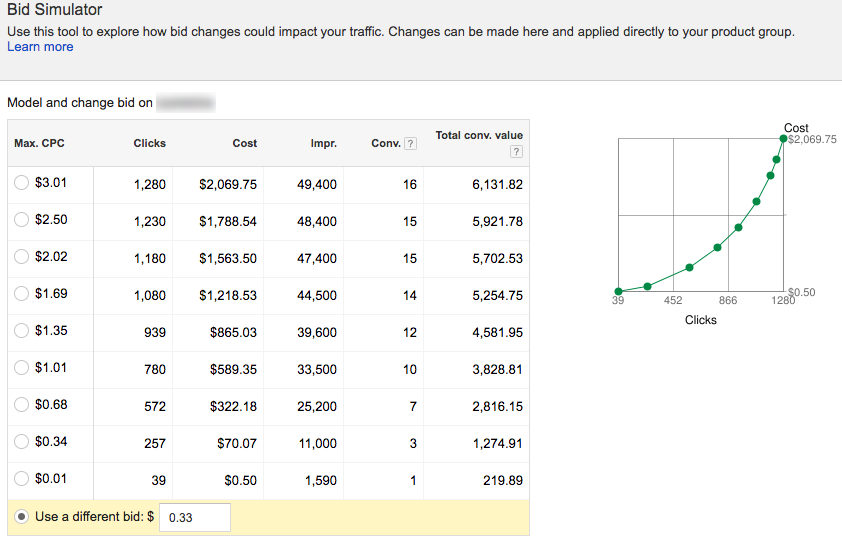
Here, there’s another derived metric that’s not directly shown, but which you can quickly calculate: average CPC. But with revenue in the far right column, and the number of clicks, we can also generate the Value per Click (VPC), which is a fantastic metric to put alongside the CPC. You can read all about my fondness for VPC in this article, but the crux of the matter is that you know your cost per click, and you know the revenue per click, and with those two metrics, you can estimate your COS (or ROAS, if you prefer), and from there make comparisons to your margins and goals. In terms of this tool, we also directly have the cost and revenue totals. Therefore, we can shortcut this time, but in many places, the VPC and CPC comparison to generate a COS will be the best approach. Let’s take another look at this screenshot, with these implied derived metrics in mind.
For example, that first row, with the hypothetical $3.01 bid, Google estimates that we’d have 1,280 clicks, spend $2,069.75 to earn them, and we’d produce $6,131.82 as a result. That means that Google thinks this $3.01 bid would produce an average CPC of $1.62, and a VPC of $4.79, for a COS of about 34 percent. If we were aiming for a COS of 10 percent, this would be catastrophic.
But if we were aiming for a COS of 10 percent, we can see that the $0.34 bid row comes in at only 5.5 percent, so our current bid of $0.33 could stand to go up, with little risk of overshooting our target. If we move up the list from there, we see that we immediately pass 10 percent COS on the $0.68 bid row, which comes out at an estimated 11.4 percent, so we know our ideal target (at least based on this data) is between $0.34 and $0.68—so, something like $0.50 might make sense here.
The chart on the right is actually more useful than it first appears, too. In this case, we see that costs climb faster than clicks, as we’re beyond the point of diminishing returns. If we’re still under COS, we can still be more aggressive (in this case, we happen to be at an Impression Share of about 43 percent), but if we’re already near our COS limit, then we can very quickly see that we ought not increase bids.
Now, Google will mix up the metrics they choose to plot in that little chart, but there’s still a shape I want you to keep an eye out for: “the knee.”
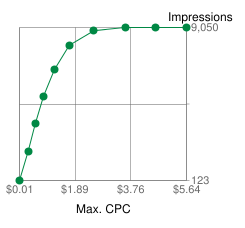
If you were bidding purely for maximum efficiency toward impression count, then you’d want to bid somewhere around the point that the mostly-climbing part of the curve transitions to the mostly-flat part—that’s “the knee.” At that point, raising the bid further isn’t likely to drive many more impressions, as you’re likely to be outbidding most of your competitors at that point.
If Your Competitor Jumped off a Cliff…
If a competitor is still outbidding you, this can be very frustrating. However, there are only two possible use cases that they’re facing, and neither of them warrants you chasing them beyond your COS limit.
First, they might have an advantage, such as higher margins (time to renegotiate with your supplier!), or a higher conversion rate (time for more A/B testing and CRO efforts!). If this is the case, then you’d have to spend a mint to overcome that difference, and you’re far better off investing your efforts in closing that gap before trying to dislodge them in the auctions.
Second, they might not have an advantage. In this case, they may not even realize that they’re burning their ads so hot, and might even be losing money. Either they notice it, and fix it, and you’re back on an even playing field, or they don’t—and that obviously leads to a type of correction, as well, as you having one less competitor after enough similar blunders. The key is to not follow them off the cliff!
Therefore, if you boil my point down far enough, it becomes this: Bid with your COS target in mind, and let your competitors lose money.